What is a Halving Event?
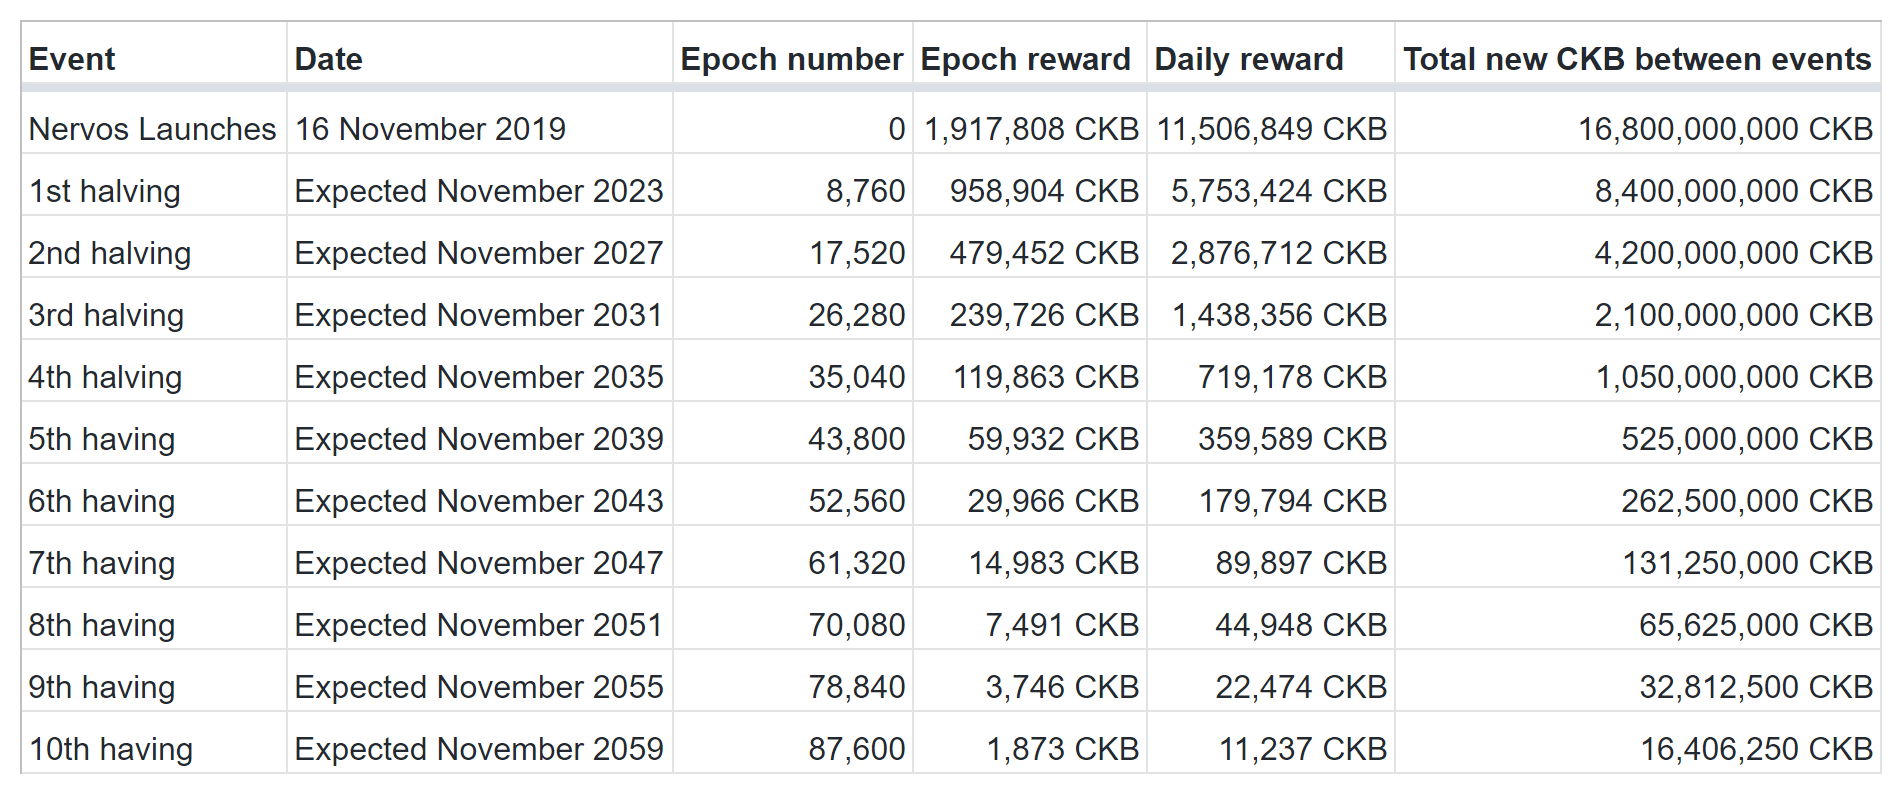
In the Nervos ecosystem, mining is used to secure the network and distribute tokens in the form of block rewards. A total of 33.6 billion CKB tokens will be created through primary issuance over a period of approximately 84 years to incentivize the miners that secure the network.
Every epoch, a period of approximately four hours, a fixed amount of CKB is introduced. Every 8,760 epochs, a period of approximately four years, this amount is cut in half. This event is called a halving and it is the point where the mining rewards from primary issuance are permanently reduced by 50%. This halving process will continue every four years until the year 2103, after which point all block rewards from primary issuance will cease completely.

What is the Significance of a Halving?
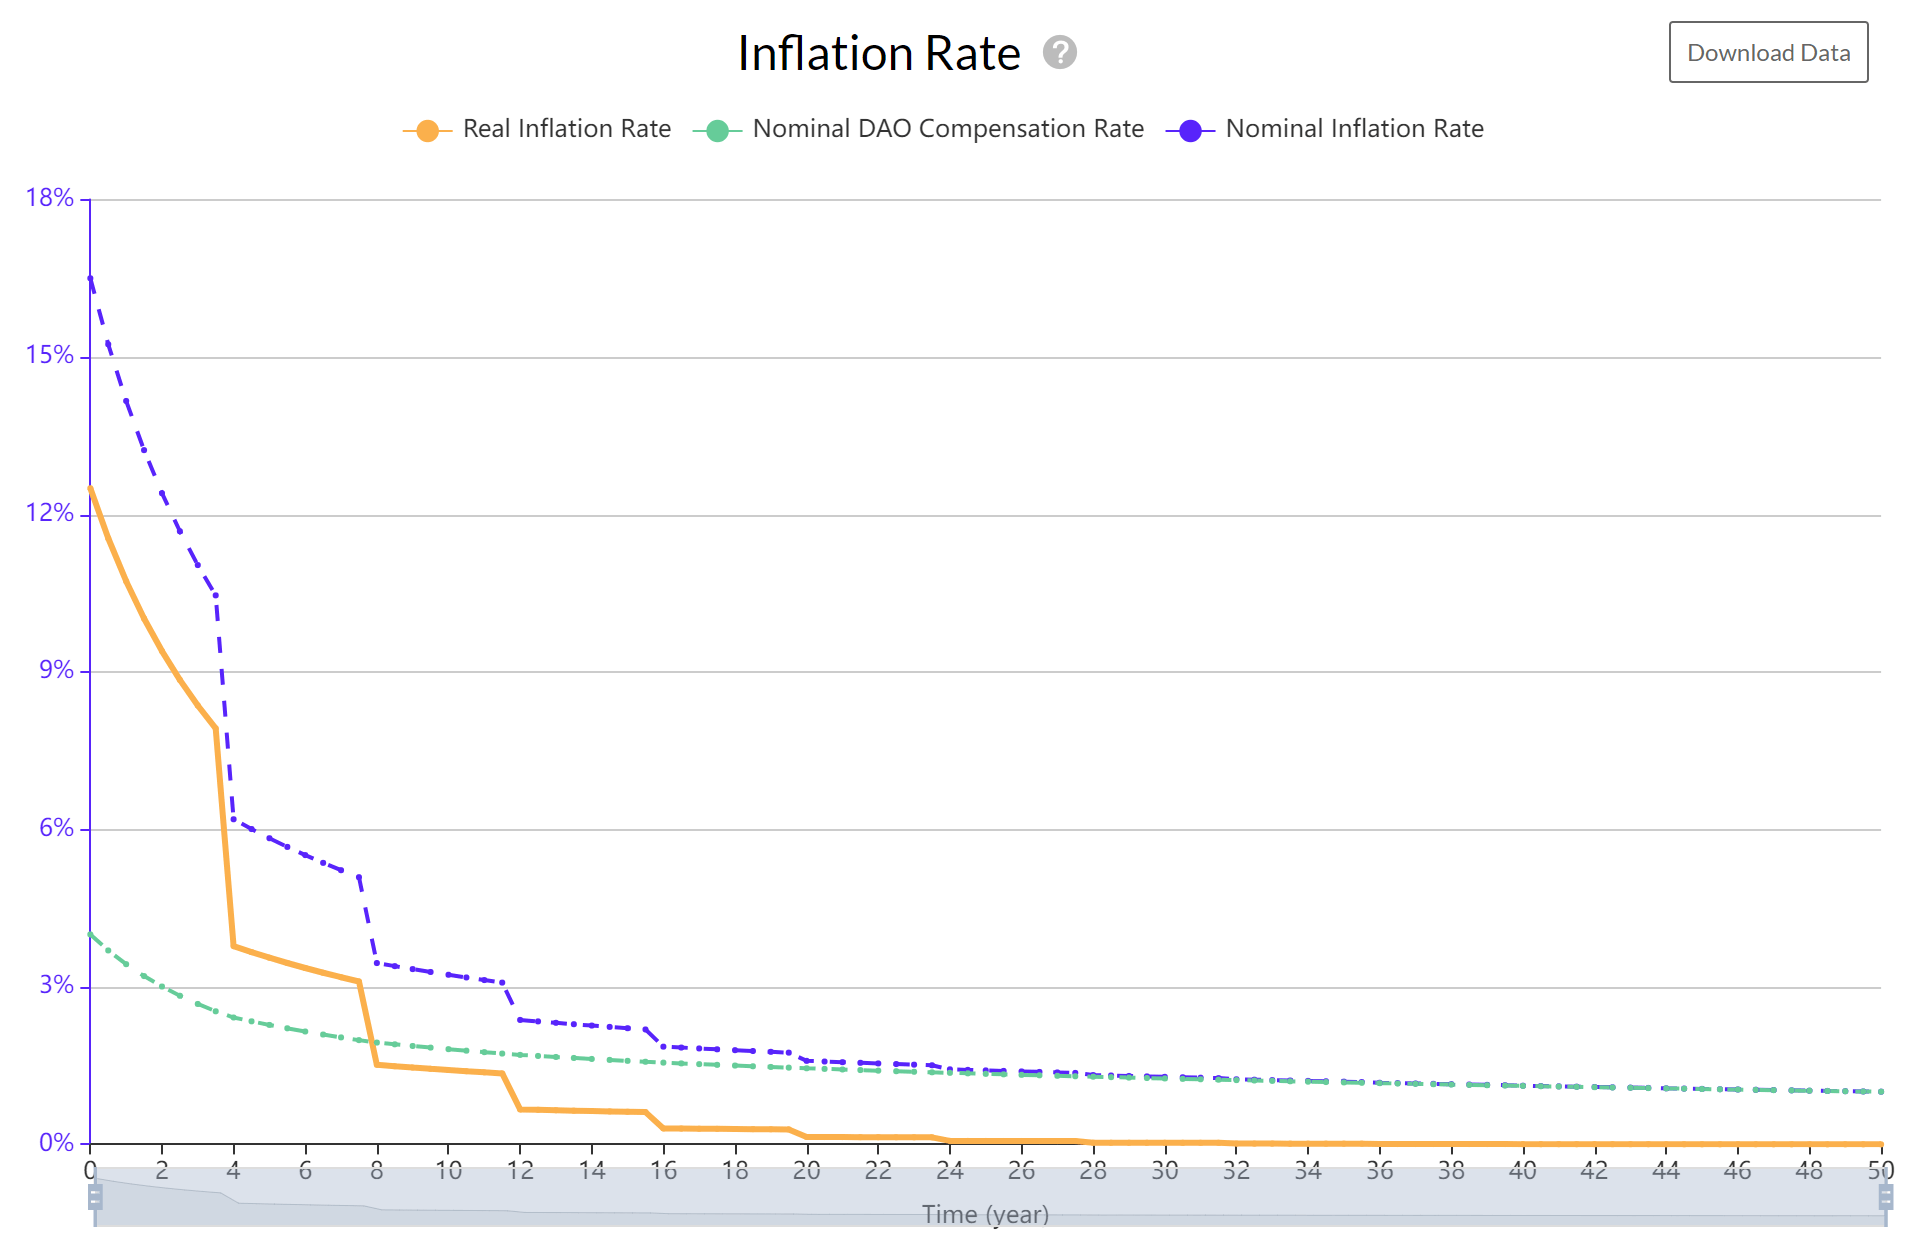
Each time a halving occurs, it causes a sharp decrease in the rewards generated per block. The supply of new CKB entering circulation is lowered, dramatically reducing the rate of inflation. This is important because it creates a shift in the underlying market equilibrium and forces a reevaluation of what is considered fair market value.
Halving events occur on a predetermined issuance schedule that cannot be changed, postponed, or delayed. Investors and community members often look forward to a halving event as something to celebrate since it marks an important milestone in the history of the project.

How Could a Halving Affect the Price of CKB?
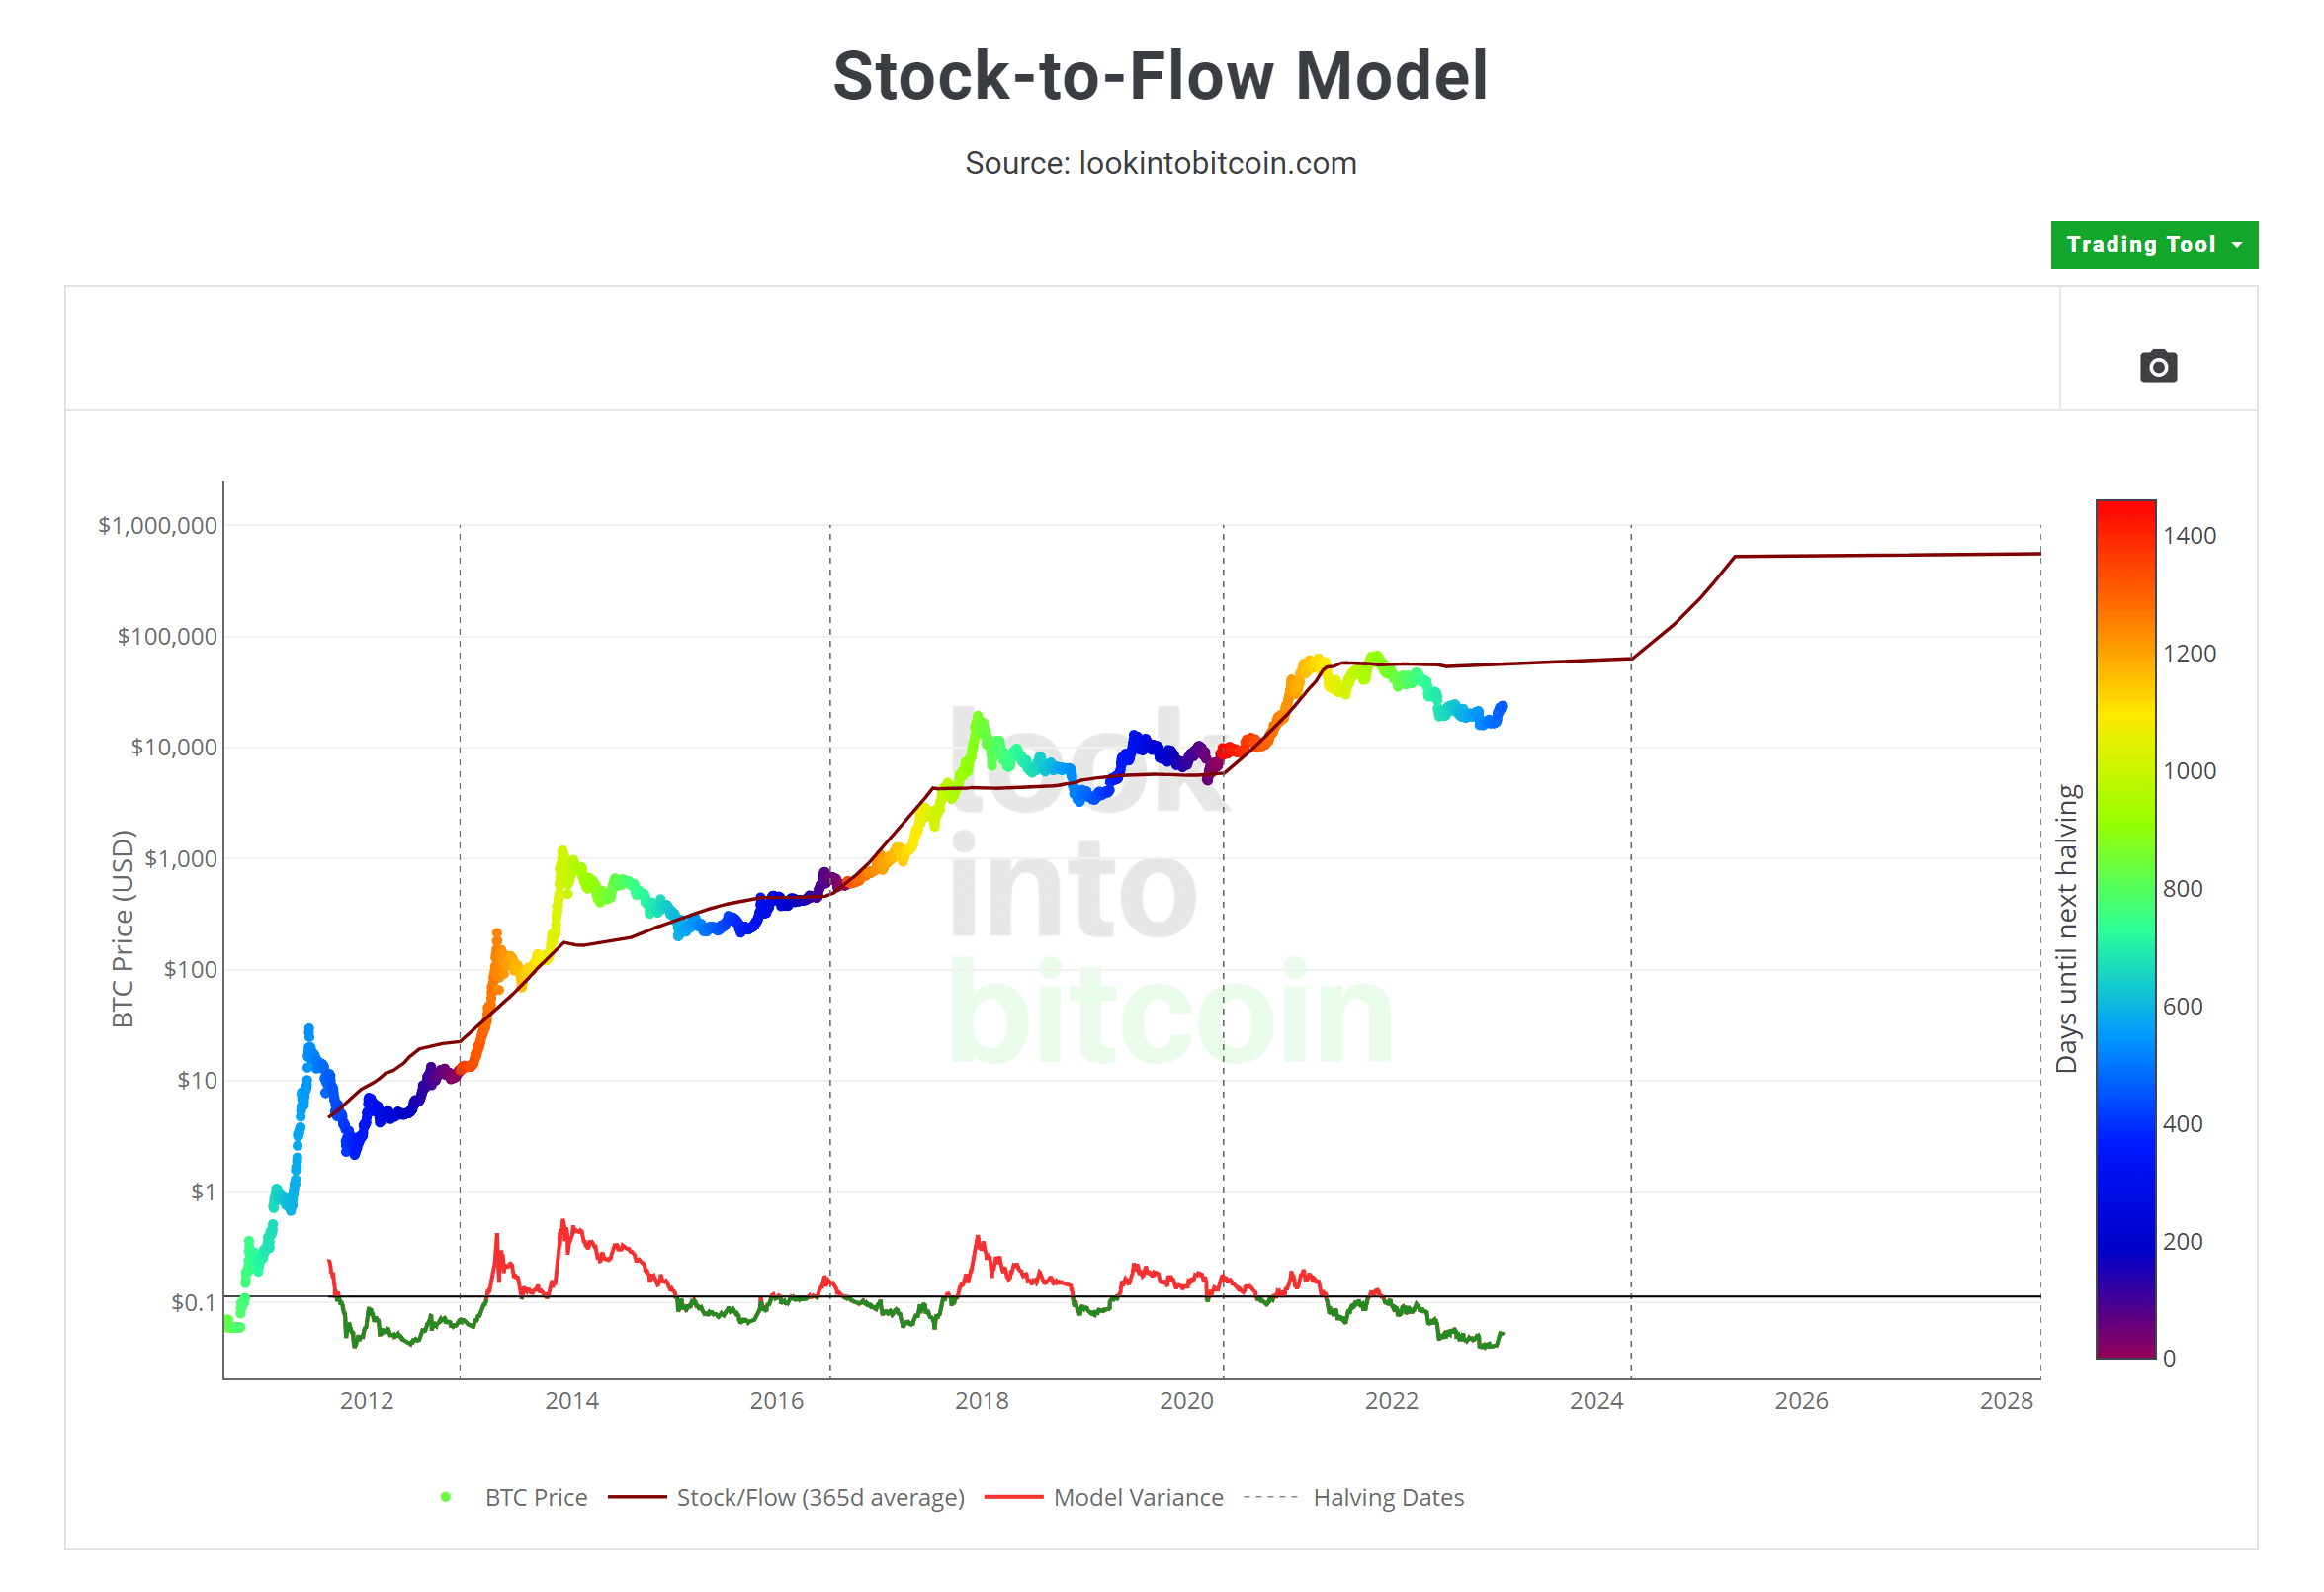
A general rule of thumb in economic theory states that steady demand with decreasing supply results in higher pricing. Bitcoin enthusiasts often use the stock-to-flow model as a way to measure the total amount of existing Bitcoin (stock) relative to the amount of Bitcoin produced per year (flow).
This stock-to-flow model predicts that a higher the stock-to-flow ratio will result in a higher the price of the asset. This model remains controversial among experts, especially for gauging short-term market sentiment. However, one look at Bitcoin's stock-to-flow chart leads many to believe the theory is worth further consideration.


